Plot a ctre object
# S3 method for ctre
plot(x, p = 0.05, log = "", ...)
Arguments
| x | The ctre object whose time series should be plotted |
|---|---|
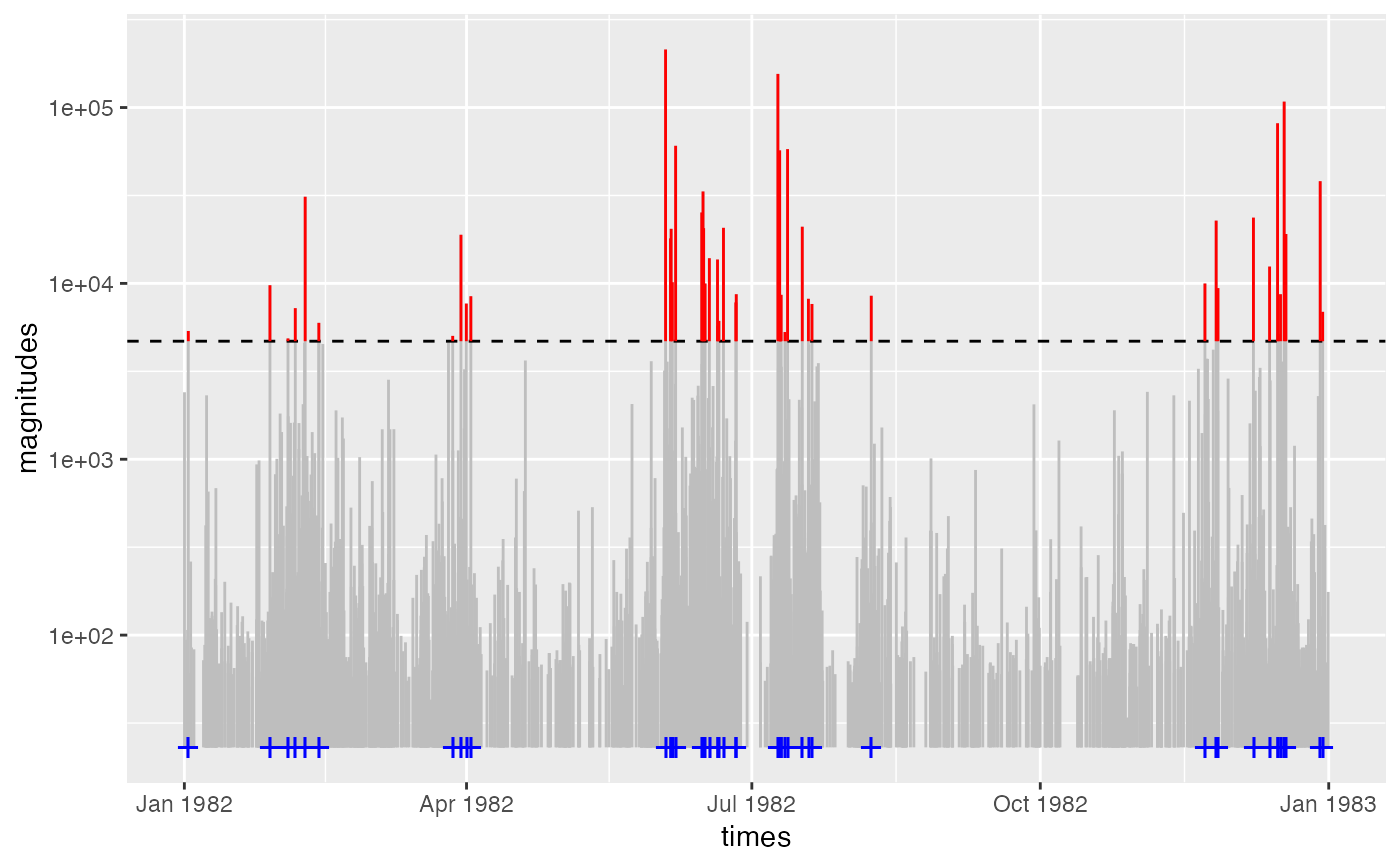
| p | The fraction of magnitudes that exceed the threshold to be plotted |
| log | Set to 'y' if magnitudes should be plotted on a logarithmic axis |
| ... | Additional plotting parameters |