See also the MJA podcast episode accompanying this article.
Our joint work (UNSW CBDRH and Statistics) which analyses Australian patient claim data using big network algorithms is now available on the MJA website. We have processed MBS claims data of 10% of Australians over the years 1994-2014, trying to shed light on the following research questions:
- What is the patient sharing behaviour of general practitioners (GPs): are there any meaningful clusters (called “Provider Practice Communities, PPC”) of GPs which collaborate and share patients? How have these clusters changed in the course of 20 years?
- How does Continuity of Care (CoC1) differ between large and small PPCs?
Datasets such as provided by BEACH (Bettering the Evaluation And Care of Health, USYD) would be ideal to tackle these questions, but were discontinued due to lack of funding, and it may take several years until Australia’s My Health Record is adopted by enough Australians to generate useful datasets.
Question 1 really is about the structure of information sharing in the Australian health system. We believe we’ve found evidence of information sharing within clusters of GPs (PPCs) which resemble the typical sizes of practices of GPs. CoC is a proxy for the sharing of important patient information sharing, which is believed to lead to better health outcomes; but information sharing can also mean that GPs have similar behaviour when referring to specialists or pathology services, among which there may be low-value services such as unwarranted surgical interventions and blood tests.
Based on the PPCs which we have identified, it is now possible to discover unwarranted variation of good and bad outcomes on the level of PPCs (practices). There are many interesting questions that can be tackled now, and as a first step into this direction, we redefined “Continuity of Care” on the PPC level, creating an indicator which is high if a patient is loyal to the same practice, rather than the same GP. It seems that the larger a practice, the less loyal patients are to individual GPs; but if loyalty to the same practice is measured, small and large practices seem to fare alike.
Big Networks
The usual approach in network clustering (which was seemingly taken by all previous papers on this topic in the medical literature) is as follows:
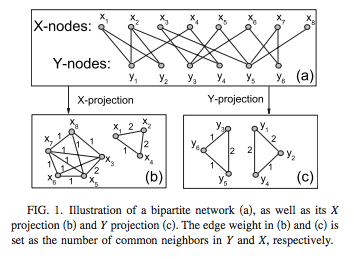
Create a network of GPs only2, where patients only appear as weights on the edges (i.e. project from bipartite to unipartite):
 (source: Wikipedia)
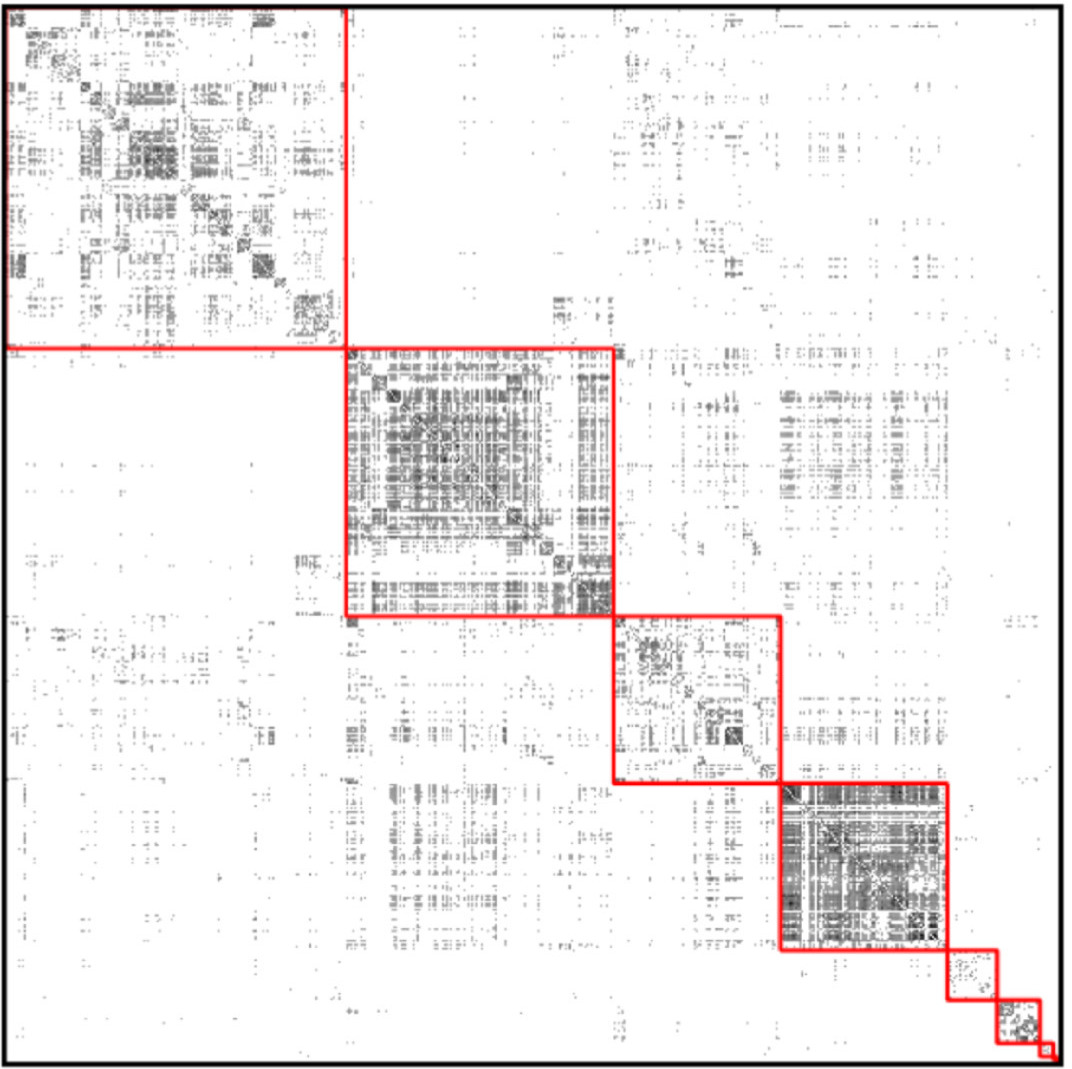
 Cluster the GP nodes by maximizing3 modularity:
 (source: sciencedirect)
The main flaws with this approach are:
- There is no good way to construct edge weights between GPs.4
- The resolution limit problem of modularity: The minimum size of discoverable communities grows with the number of nodes $N$ in the network, roughly like $\sqrt N$. Since we study thousands of GPs, this problem is prohibitive.
- Modularity assumes that all block structure is assortative, which can be dangerous; moreover even completely random networks can have high modularity.
Using the Python package graph-tool, we were able to:
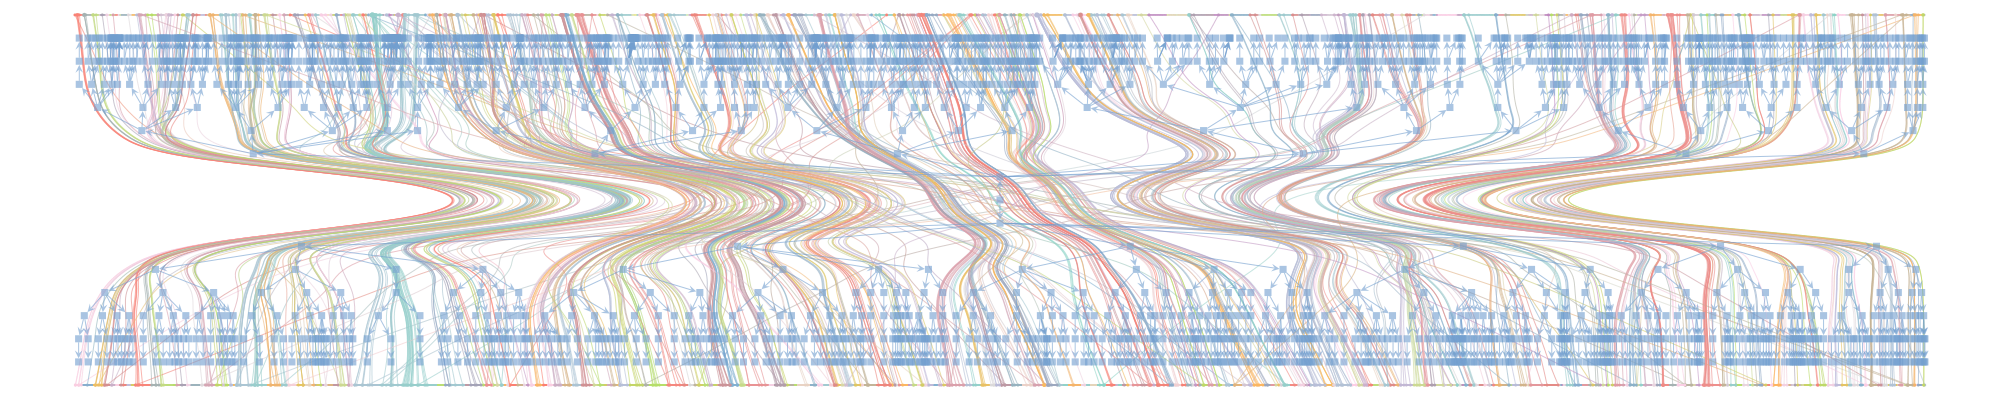
- Avoid the bipartite projection, even though this meant dealing with millions of nodes (patients and doctors) instead of thousands (doctors only).
- Fit a hierarchical stochastic blockmodel, which allows detecting much smaller communities. Moreover, the block structure respected bipartiteness, meaning that each block was made up of either doctors only or patients only.
Computations
The main challenges were:
- Installing graph-tool: pip and conda are not an option, you have to compile it from source, or install the native Linux / MacOS X packages.
- RAM usage: graph-tool needed up to 64GB of RAM. We’ve used the Katana computational cluster at UNSW and got excellent support along the way.
- Numerous runs: The hierarchical blockmodelling algorithm converges to a different solution every time; to be somewhat confident to have found a good minimum of the description length, we needed 4 runs of up to 6 hours each, for each of 5 regions.
GitHub Repository
The full Python code used for this project, as well as more details on the blockmodelling approach, can be found on the CBDRH GitHub page.
Conclusion
Using hierarchical stochastic blockmodelling, it is possible to use data which is routinely collected by GPs to monitor characteristics of Australian general practices. Future research will clarify how these characteristics affect patient care.
A patient typically seeing the same GP, or GP clinic, experiences high CoC: $${\rm CoC} = \frac{\max \left\lbrace n_k \right \rbrace}{\sum_k n_k}$$ where $n_k$ are the numbers of visits made to different PPCs.
^In the graph shown, suppose X are the patients and Y the doctors; then the Y-projection is a network of doctors only, with edge weights computed from the number of shared patients.
^The picture shows the adjacency matrix, where each row and column corresponds to one node, and a black dot means there is an edge. The red squares represent a grouping of nodes. Modularity, in a nutshell, is the gain in the number of within-group edges achieved by the grouping, compared to the expected number if all edges were reassigned at random.
^If you go by the number of shared patients, this discards all patients which have only seen one GP, and makes it impossible to find single GPs. If you go by Jaccard index, this leads to weights between 0 and 1, which is not useful for most community detection algorithms.
^